Trump's Tariff Policy Wipes $10 Trillion — Nifty Panic Selling & Indian Market Weekly Analysis — Week 14, 2025
Disclaimer: Information and resources shared on this website are only for educational and learning of our readers/members. They should never be interpreted as a buy/sell recommendation of any asset/stock. We encourage you to do your own research and due diligence.
Week 14: 31st March - 4th April, 2025

TABLE OF CONTENTS
Major Global Indices
S&P500
Nasdaq
US Dollar Index (DXY)
Indian Indices
Nifty50
Nifty500
Midcap Index
SmallCap Index
Commodities
Silver Futures
Market Breadth of Indian Stock Market
Sectoral Indices
Winning Stocks
What should traders do in this market scenario?
GLOBAL INDICES
We just witnessed a historic week. The price and non-price data of this week will be talked and analyzed for years, by the traders and investors. It is going to be a key pivot on the charts of global indices! What really happened?
On 2nd April’25, Donald Trump announced the new Tariff Policy. The event was well anticipated, but the magnitude of tariffs was no less than a knock-out punch for the Silicon Valley. The major stock indices of the US witnessed biggest fall in 5 years, wiping off more than $10 Trillion. Analysts are predicting higher inflation, economic de-growth, and lay-offs in the near future. This can further impact the Fed’s rate cut plans.
Every trader should accept that technical charts (of stocks/indices) ultimately speak the truth. The global cues are also hidden in the price action of major global indices. Therefore, before we look at the Indian stock market scenario, it’s important to see what happened in the Major Global Indices, during the week:-
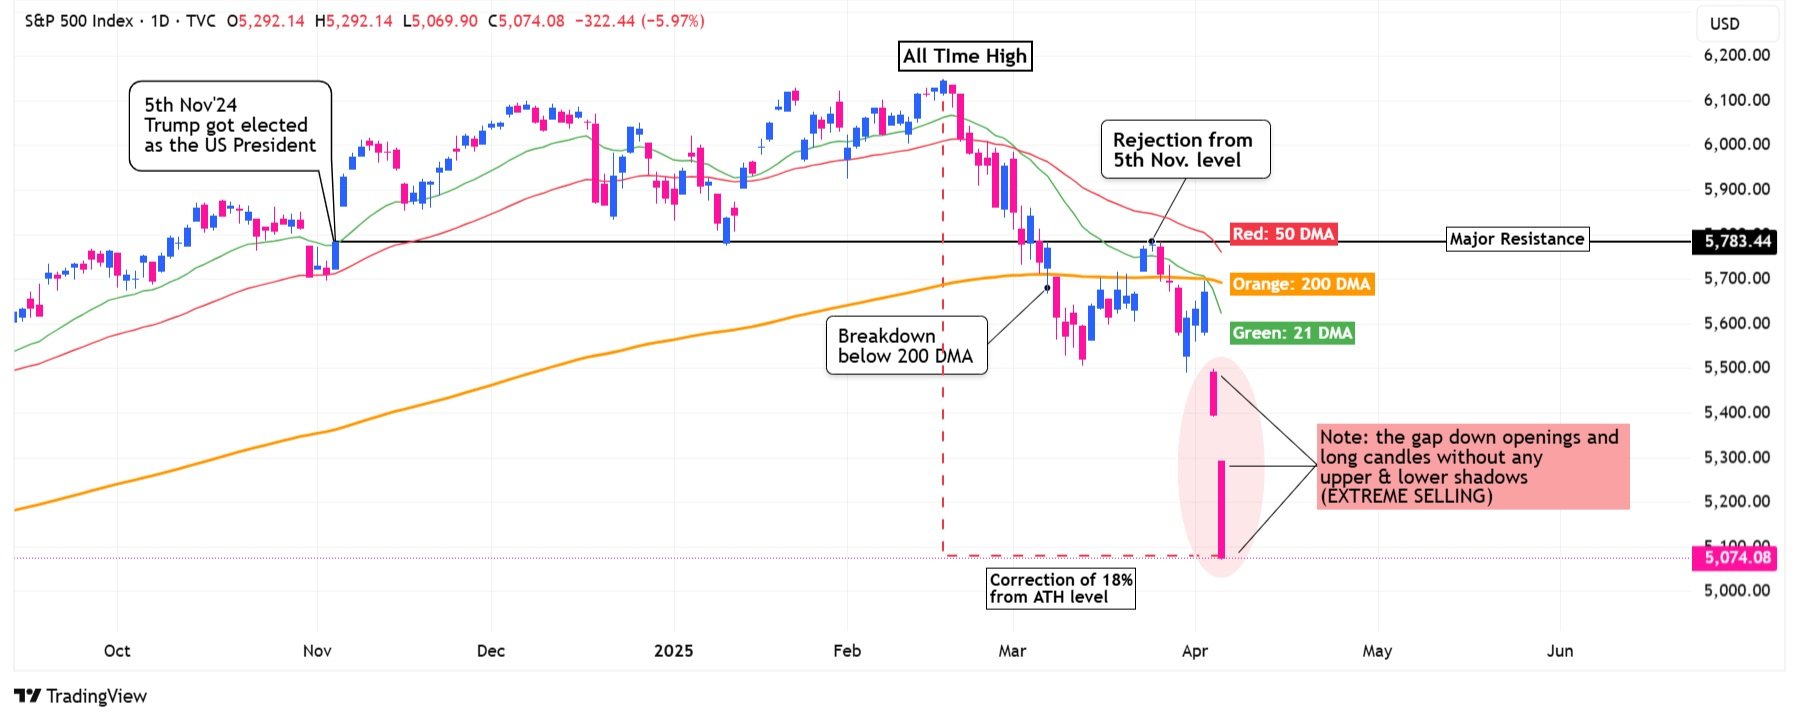
S&P500 Index: chart on ‘daily’ timeframe. (Source: TradingView)
S&P500 dropped 9% during the week in response to Trump’s Tariff Policy announcement. The fall on Thursday and Friday (highlighted in red) was brutal that can be technically indicated by gap-down opening and no upper/lower shadows. This closing was ominous and extreme bearish. Index has corrected around 18% from ATH, and is at the verge of entering bear phase (which starts when Index corrects more than 20%). The technical chart of the Index clearly suggests that more pain lies ahead in coming week(s).

Nasdaq Index: chart on ‘daily’ timeframe. (Source: TradingView)
Nasdaq dropped 9.8% during the week. Index has officially entered the Bear Phase as it has corrected more than 20% from it’s high in Feb’25. In the chart above, you can clearly identify the Stage-3 (Distribution) and Stage-4 (Decline) phases of the Index. The technical chart of the Index clearly suggests tough time for the IT stocks in the US.

Bitcoin Price Chart on ‘daily’ timeframe. (Source: TradingView)
The heavyweight crypto currency-Bitcoin showed remarkable resistance during the initial brutal sell-off witnessed in the US stock Indices. The weekly price movement was flat until Sunday, when BTC saw a sharp drop of 6.2%, breaking below the narrow range just below it’s 200DMA (orange line). BTC is still trading above the 5th November’24 pivot level (unlike major stock indices of US). This is clear outperformance of Bitcoin over S&P500 or Nasdaq. Coming week(s) are crucial as chart suggest ‘confusion’ among Bitcoin investors. Any violation of 5th Nov support level, can trigger next leg of sell-off.

US Dollar (DXY) Index: chart on ‘daily’ timeframe. (Source: TradingView)
DXY Index is trading below all it’s key MAs (21D, 51D and 200D), also below the important pivot of 5th November’24. US Dollar Index has created a new lower-low during the week. This indicates USD losing it’s value. This can be a big positive for FIIs investing in Indian stock market. The strengthening of USD vis-a-vis INR was key reason for foreign investors to pump-out their investments from Indian equities.
INDIAN INDICES

Nifty50 Index: Price Chart on ‘daily’ timeframe. (Source: TradingView)
Nifty50 Index breaks below it’s narrow range consolidation just above 200 DMA is yet to confirm the trend. Index is trading below all it’s key MAs - 21D, 51D and 200D EMAs. The closing indicates a strong bearish undercurrent that is likely to pull the Index lower in coming week(s).

Nifty500 Index: price chart on ‘daily’ timeframe (Source: TradingView)
Index is currently trading below all it’s key moving averages - 21D, 51D and 200D EMAs.

Nifty Midcap100 Index: Price Chart on ‘daily’ timeframe. (Source: TradingView)
Index is currently trading below all it’s key MAs - 21D, 51D and 200D EMAs. If selling continues in the coming week(s), which is likely, the Midcaps can witnessed extreme selling pressure.

Nifty SmallCap100 Index: Price Chart on ‘daily’ timeframe. (Source: TradingView)
Index is currently trading below all it’s key MAs - 21D, 51D and 200D EMAs. If selling continues in the coming week(s), which is likely, the Smallcaps can witnessed extreme selling pressure.
PRECIOUS METAL : SILVER

Silver Futures (MCX): Price Chart on ‘daily’ timeframe. (Source: TradingView)
Silver witnessed brutal selling in response to Trump’s new tariff policy. It dropped more than 12% in last two trading sessions. The behavior was unlike the common perception that precious metals give safe shelter during global volatility. Why did this happen? Analysts predict global slowdown, thereby reducing the demand for Silver that has wide industrial use application. Silver Futures that were above all key MAs during the previous week, are now trading below all of them - 21D, 51D, and 200D EMAs. Compare how Gold performed during this extremely volatile week!
MARKET BREADTH OF INDIAN STOCK MARKET

Market Breadth at the end of Week 14, 2025 (Source: ChartInk)
Stocks trading above 21DMA: reduced drastically during the week - from 43% on 28th March to 39% on this week’s close.
Daily Market Moves: look at the number of stocks ‘below 3%’ on section. The number was significantly high on 4th April - 1065 stocks witnessed a fall of more than 3%. Clear panic selling!
52 Week High/Low: the number of stocks making new 52W ‘lows’ was over powering on 28th March, followed by 1st April and 4th April, indicating selling pressure and weakness in broader market.